
Two Paths to "Improvement"
A Simple Saturday Thought Experiment

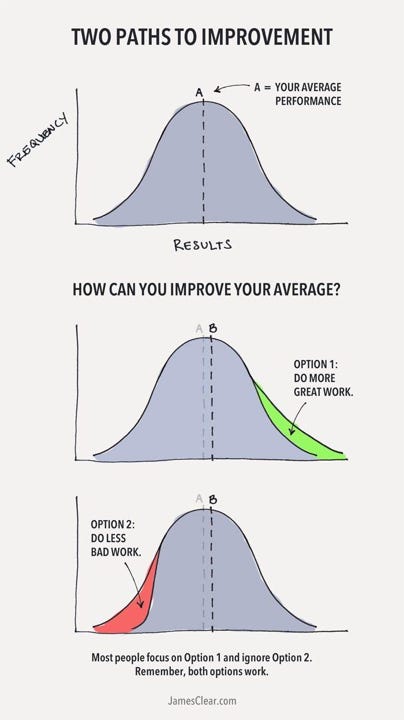
THE AIM for this newsletter entry is to bring the above graphic to your attention as a bit of a brain-teaser to test your grasp of Dr. Deming’s theory, particularly with respect to a systems view of performance and improvement.
First Question: Is This a Correct View of Improvement?
Imagine that you received this graphic from a well-intended colleague or manager, perhaps as a post on LinkedIn. What is your first reaction? Does this comport with how improvement really works, or how we want it to work? Is this a correct view of improvement? Why or why not?
How would we know whether what we have done is an actual improvement and not a mirage?
Next Question: What Does It Mean to Do More Great Work?
Think about your current situation at work: what would “above-average” work look like for you? What are the ingredients? What defines “great work” ?
Have you done “great work” that was above-average? What contributed to your success: your effort to excel beyond usual expectations, or the dereliction of effort by others by comparison? How much was under your direct control?
What does it mean to do “more great work” ?
Next Question: What Does It Mean to Do Less Bad Work?
Similarly, what would “below-average” work look like for you? What defines “bad work” apart from “great work” ? Is “bad work” the negation of “great work”?
Have you done “bad work” that was below-average? What contributed toward this result? Did you not excel beyond usual expectations, or did others over-achieve pulling the average up? How much of this situation was under your direct control?
What does it mean to do “less bad work” ?
Next Question: Is Improvement Additive?
Given the questions answered so far, consider what the curves in the diagram imply about the distribution of results you can achieve around a mean, and how the curve can shift according to the addition of “great work” or the subtraction of “bad work”, with the implication that the latter is more overlooked than the former.
This suggests that improvement is conceptually additive: the distribution will shift to the right whether we sum up “great work” or sum up removing “bad work”. Is this correct? Is improvement additive? Why or why not?
Final Question: What is an Improvement?
Taking this all into consideration, what is an improvement in your context? How is it achieved? What does it depend on to shift the distribution of your results to the right? What does it mean to improve on average?
Bonus Question: To What is an Improvement or Non-Improvement Attributed?
Let me know your thoughts below on riddling this through using your burgeoning knowledge of Dr. Deming’s theory of management.

Neither illustrated approach is likely to produce long-term improvements. A more useful approach #1 would be to improve predictability by reducing variation, followed by #2 moving the mean of the process outputs to an optimum value and #3 continuing to reduce variation as long as economically feasible while taking into consideration losses to society (application of the Taguchi lost function).
The phrases “less bad work“ and “more good work“ when operationalized are likely to include inspection activities as work is evaluated as “bad” or “good” in comparison to some specification. Comparison to specifications rather than process limits often lead to decisions which ignore the source of variation (common cause versus special cause) and thus increase variation.