
PBC Analyzer PRO Alpha Release
One Step Closer to Going Live - Want In?

THE AIM for this post is to share with you a milestone I reached yesterday in the development of my educational Process Behaviour Chart app: it is finally in a stable enough state that it will be going live and available, initially to paid-tier subscribers of the newsletter.
Yesterday, I shared this achievement and demo video below with paid subscribers as a thank-you for their support and notice that I’ll be pivoting from adding features and fixes to getting the app off my machine and into production, with the first step of setting up an authentication method to grant access.
Great. So… What Does it Do?
The AIM for the app is to make creating Process Behaviour Charts from your own data easy, engaging, and fun.
Why do this? Because when you take your tabular data and plot it into a PBC, suddenly things jump out that you couldn’t otherwise see: that elevated or depressed point is outside of a red-line, indicating it’s really unusual compared to its peers, or there’s a run of a dozen data points that are travelling below the mean— why is that?
It’s a super-powered flashlight that lets you peer into your data, revealing hidden insights like whether you can link causes and effects, and if the system the data describes is stable and predictable, or the opposite.
And it can be applied to almost (almost) any data that has been generated by a system or process.
Instant Insight
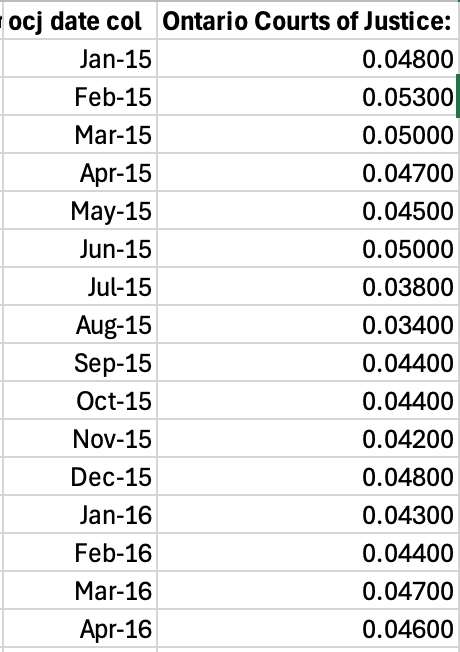
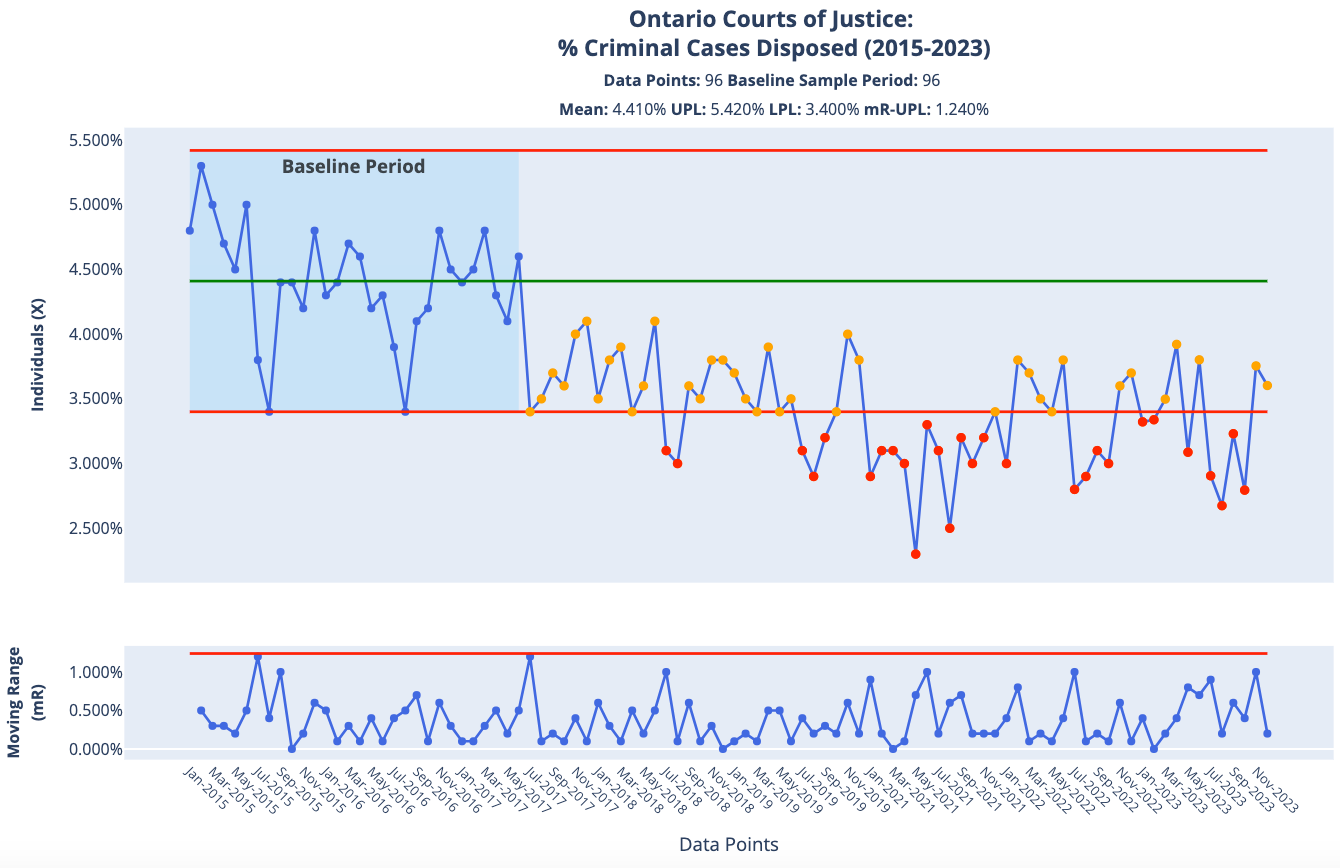
A key feature of PBC Analyzer PRO is how it “lights up” signals in your data by default. My “hello world” example is from the Ontario Courts of Justice: % Criminal Cases Disposed (2015-2023). It starts off looking like this in Excel:
And here is how it is plotted in PBC Analyzer PRO with Rule 1 (red) and Rule 2 (orange) signals lit up. It’s a target-rich environment:

Rule 1 data points are so extraordinary and dissimilar from their peers that they warrant an immediate flagging for review, while Rule 2 data points are weaker signals of a change in disposition of the system — they could represent a shift or transition in how it works, which in this case would be how overloaded and understaffed they were about to become.
We might have a hunch that the system changed on the first data point after the last Rule 2 signal on July 2017, and want to see where the variation takes us. We can click on that data point to get immediate feedback:
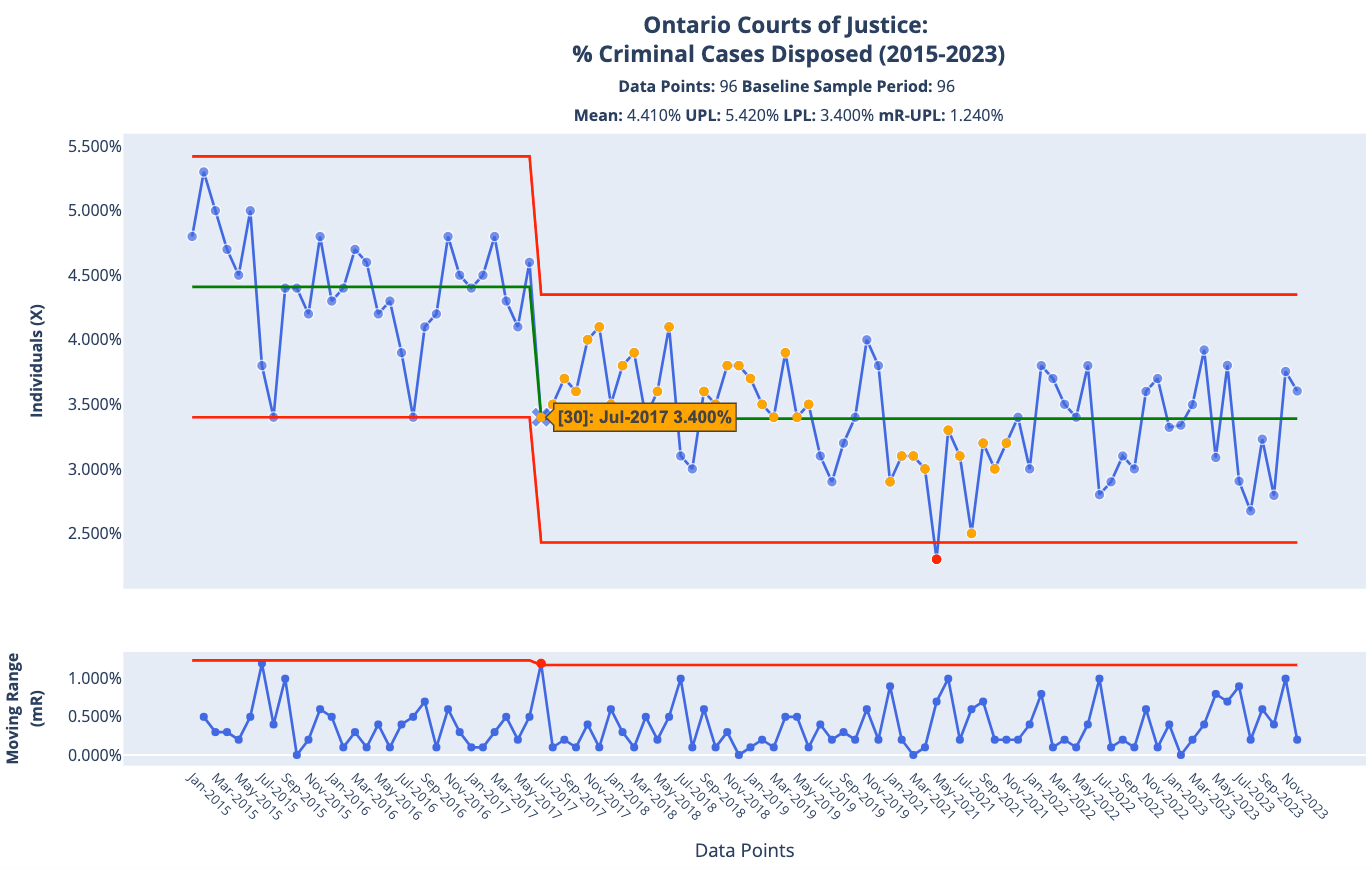
A dramatic change! The first segment has now lost all of its signals because it is in its own period apart from its peers, and is in a stable and predictable state. But look at everything from that point on: More Rule 2 signals, and even a lone Rule 1. Typically, if all data points fall within the process limit lines, we say it’s stable and predictable, but the signals suggest we have special causes worth investigating.
And that should be the first action taken, not creating pretty charts!
However, we’re learning how PBCs work, so we have another hunch that the middle period of case disposals was stable and predictable up until the first Rule 2 signal. So we click another data point on January 2021 and get a whole new perspective:

Prior to this analysis, had we been asked the question: “What’s the average percentage of criminal cases cleared per month in the Ontario Courts of Justice system?” we might have said 3.71% and been done with it. Now, we can say that from 2015 to 2023, the courts have had three different periods, with average disposals of 4.41%, 3.5%, and 3.23%. Moreover, we know when and where to look for reasons why: July 2017, and January 2021. You could not know this with any other technique or by comparing two data points in isolation.
How Does this Work?
While the mechanics are hidden, you can explore how the chart is created by exporting the analysis to a formatted Excel spreadsheet with the calculations done:

This is how I have traditionally made my charts by-hand using a template, which while I can do quite quickly, is still not as fast as PBC Analyzer PRO, especially when it comes to re-calculating or shifting limits as we’ve just done with two clicks. For those who want even more understanding, I’ve written about PBCs here many times before - use the search bar above to find them.
Setting the Baseline Period
A new feature I added last month was the ability to use any range of data points to calculate the limits against, called the Baseline Period. We can apply this to our test case by resetting the chart to defaults and highlighting the first segment of data points with Rule 1 and Rule 2 signals:
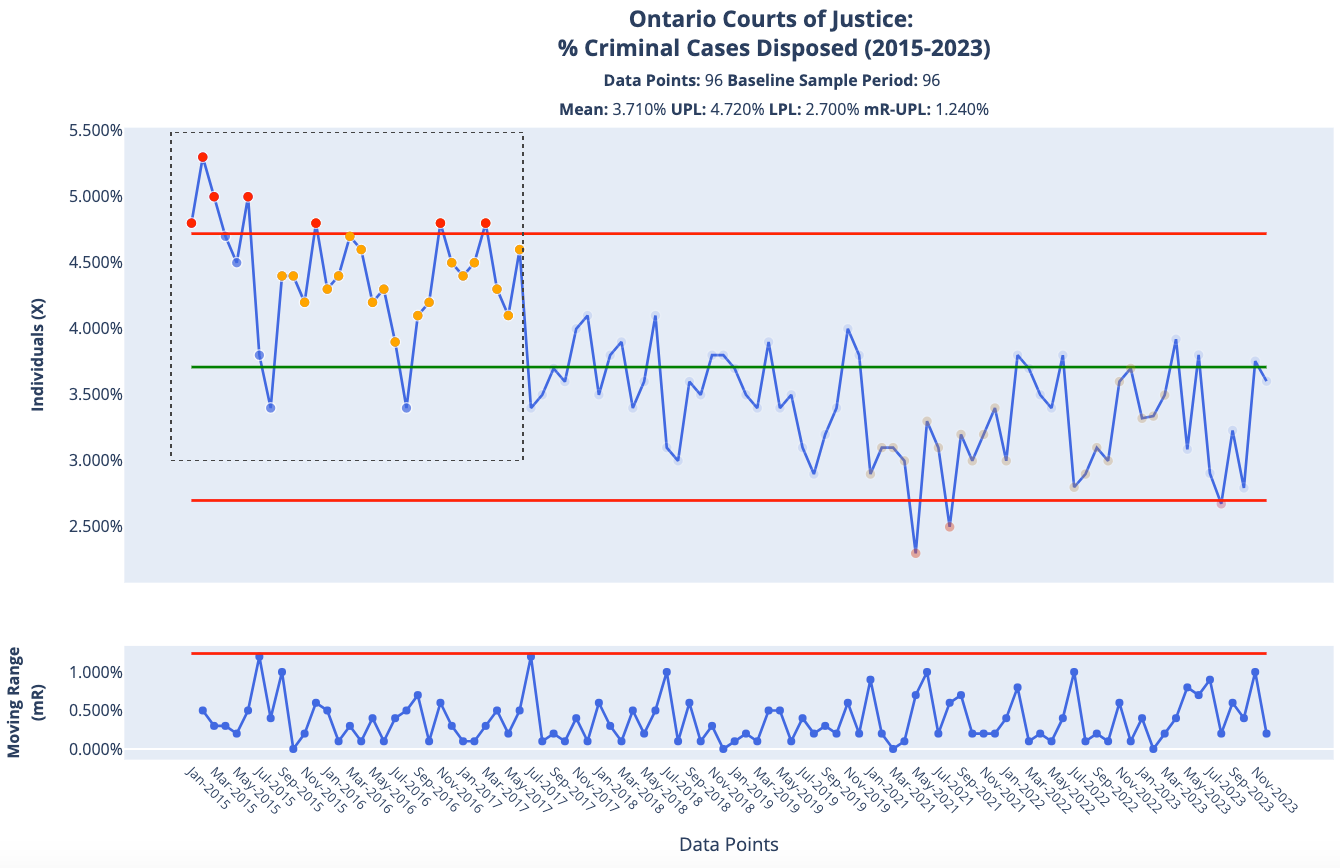
And instantly we get a new view that cross-confirms our hunch when we clicked to create a new limit: by using the first thirty data points as a baseline and extending the average and limits out from this vantage point we get a much sharper view of the system’s declining performance from July 2017 onward: something has definitely changed. We can now ask interesting questions about why that is:
Imagine what you could do with similar analyses on your own data at work, school, or around the house?
Encouraging Joy in Learning Through Play
One of Dr. Deming’s top motivations in teaching his theory was to see joy restored not only in work, but also in learning. When I was envisioning this app, I wanted something that could put this principle into action to make learning about variation fun and engaging, to “switch on” the neurons in new users and trigger their intrinsic motivation to learn more. My prediction is that by making the chart’s key features interactive, this can be accomplished.
I tested this hypothesis with my 16yo son last month. With a little guidance and coaching he quickly picked up how to start analyzing different datasets by playing with the charts, exploring the signals that were shown, then clicking to shift the limits to see if he could validate hunches or predictions where the system moved from one period of stability to the next.
For over an hour and a half he was engaged in learning, delighting in how the chart responded to his interactions, prompting interesting questions about the data, the chart, and his thoughts on what was going in behind the data points. He had learned more in that time than I think I’ve ever conveyed to managers in twice as long in my past engagements.
Now, imagine what this tool could do in a classroom where students are taught the differences between enumerative and analytical studies and how to analyze time series data for signals, and how to make interventions into systems and test for their effects? I want to find out…!
Plans from Here
As I said above, the plan is now to pivot and get this app stood up so you get to play with it on your own data. I am going to be throttling down on my development as I am also working on preparing proposals for work to pay the bills, so I will be moving on this front as fast as I can under these constraints.
In the meantime, if you are a free-tier subscriber, thank you for reading so far and being part of The Digestible Deming community. If what I’ve shown so far piques your interest and you want to help bring it to life, do consider upgrading your subscription to get early access to PBC Analyzer PRO when it goes live - I’d be really chuffed if you did! If not, no worries - I still appreciate your support as a reader!
As always, let me know your thoughts in the comments below.
Cheers,
