
Generating Process Behaviour Charts with ChatGPT4
New Feature No Substitute for Excel and Eyeball Mark I, For Now

THE AIM for this brief post is to share with you my early experiences playing around with ChatGPT4’s new Data Analysis feature that allows you to upload data in a variety of formats and have the LLM engine analyze and render it into a variety of visualizations, including Process Behaviour Charts.
Before getting too excited, let me urge some up-front caution: Like all things ChatGPT it’s not quite baked, yet: at present it is no substitute for a human who understands how to calculate process limits for a PBC and interpret corresponding signals. However, this could all change in the future…
Getting Started…
I noticed the new feature earlier this morning on the menu, which it helpfully truncates as “Data An…”:

So I clicked and asked whether it could render a PBC and was pleasantly surprised:

I decided to try it out on a simple test PBC I had on-hand to validate ChatGPT’s calculations against. As a reminder, I use the same methods as Dr. Donald Wheeler teaches in his books and seminars, ie. my limits are calculated from the mean of the data points +/- 3 * average of the Moving Range (mR-BAR) / 1.128. Here’s what my sample spreadsheet looks like, NB: the respective avg, upl, and lpl values of 310.2, 385.427, and 234.972:

I uploaded my Excel worksheet as-is via the prompt paperclip button:

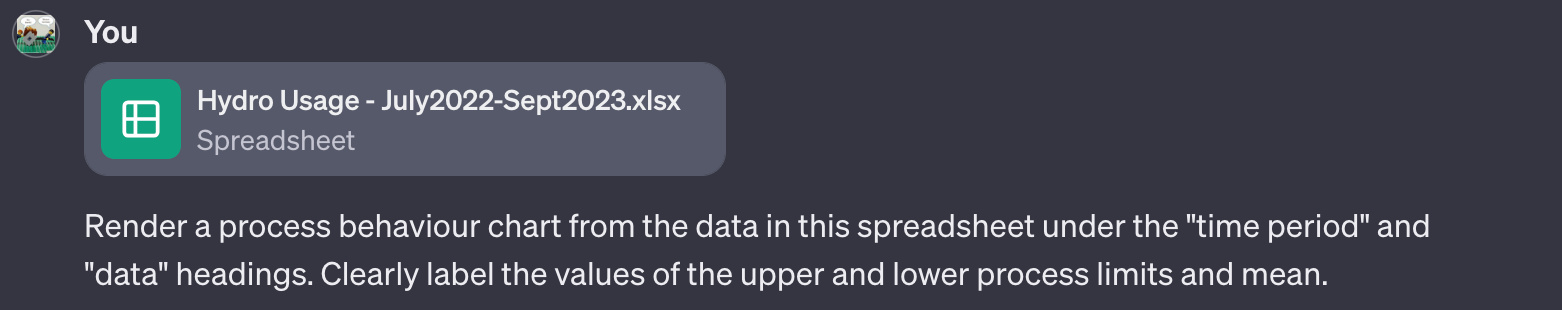
I then asked it to render a PBC from the worksheet focusing on the “time period” and “data” columns:
ChatGPT4 then crunched away, cleverly acknowledging there were more columns of data than I wanted to analyze, but limiting itself to what I asked for:

After a minute or two it then rendered the chart that looked right. However…

… when I reviewed the summary of the calculations for the limits, I discovered it was off from my expectations:

So, I clicked the [>_] link at the end of the paragraph to reveal the behind-the-scenes analysis which is all done by generated Python code. I confirmed that ChatGPT was using the wrong method for calculating limits on a PBC, ie. standard deviation:

After admonishing ChatGPT for its mistake it apologized profusely, agreed I was right and produced a corrected chart with the correct limits of 385.43 and 234.97:


Note as well that just because you ask for a PBC, doesn’t mean you’ll get both the individuals (X) and Moving Ranges (mR) chart every time, even within the same chat. Sometimes it knows to do this, others you have to remind it. In this case, it forgot.
I next examined the generated Python code to confirm the limits were calculated correctly, this time, and noted it used a rather clever one-line method to calculate the Moving Ranges. It also used the correct scaling factor (1.128) to apply to the mean of the Moving Range to get the limits:

So, like most of my experiences with ChatGPT4 to-date, it’s a matter of being prepared to invest some up-front time cajoling the LLM into doing what you want and tolerating its inevitable errors. This was a relatively simple request, and in subsequent tests of more advanced analyses, it proved about as adequate as a new assistant who has just learned how to create a chart and needs reminding of the rules.
Verdict: Not Quite Ready for Prime-Time
While impressive and fun to play around with, I won’t be relying on ChatGPT4 to render my Process Behaviour Charts any time soon. I was disappointed not only with the mistake it made in calculating the limits and inconsistency in providing an accompanying mR chart, but also with the time it took to crunch my spreadsheet, translate the analysis into Python, and then render the chart. In a fraction of the time I could just paste my data into my Excel PBC template and have both the X and mR charts rendered instantaneously with the correct limit calculations - no cajoling required.
Now, these are early days of course, and the time may soon come when ChatGPT4 or 5 or 6 will be able to do this and more in the blink of an eye, but it won’t eliminate the need for a human to interpret the results for signals. In another effort, I asked ChatGPT4 to shift the limits according to signals in the data (that I had to provide) and got this dog’s breakfast that it thought was helpful:

In the above chart, ChatGPT thought that instead of re-plotting the limits for each shift, it would just keep the original limits “for comparison” and added new limits on top. Also, note the way it processed a gap in the data with a “dragged” line. I had it remove this with an earlier prompt which it promptly forgot when re-calculating the limits. Frustrating.
For now I would not recommend using ChatGPT4 for PBCs unless you understand how the calculations are performed and whether the LLM is generating the right results, and even then, for the time you’ll invest you may as well just paste your data into my Process Behaviour Chart Template (v1.3) and get the right limits calculated in under a second with a corresponding X and mR chart for the effort, using the time saved to fine-tune and re-calculate the limits as-needed.