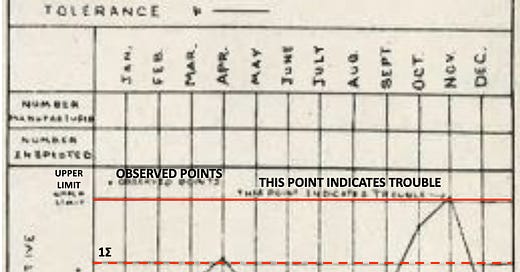
THE AIM for this brief post is to share with you a bit of rare esoterica that I stumbled across on LinkedIn via a post by process improvement specialist and consultant, Marcelo Grimaldi, about Dr. Shewhart’s very first prototype of a control chart that he developed while at Bell Labs in 1924. It is excerpted from a special memorial issue of the Journal of the American Society for Quality Control published in August 1967, about five months after Shewhart’s passing.
Shewhart was, of course, a life-long friend and mentor to Dr. Deming who strongly influenced his thinking about variation and the application of the scientific method to process improvement using PDSA cycles.
As shown above, Shewhart presented his chart as part of a mocked-up inspection report a supervisor or manager might use for tracking their monthly defects as a percentage of total units, which given his breakthrough discoveries on process variation at Bell Labs, probably meant telephones or telephone components. It includes all the features you’d expect, eg. a central line or mean, 3-sigma upper and lower limits , and curiously also 1-sigma limits, and data points that he denotes as P—more on this later…
Included with the illustration is an accompanying letter Shewhart wrote to a colleague he shared his prototype with who was having some difficulty coming up with an inspection report that could quickly communicate how well their production runs were doing:
Transcribed, it reads:
MR. R. L. JONES:-
A few days ago, you mentioned some of the problems connected with the development of an acceptable form of inspection report which might be modified from time to time, in order to give at a glance the greatest amount of essential information.
The attached form of report is designed to indicate whether or not the observed variations in the percent of defective apparatus of a given type are significant; that is, to indicate whether or not the product is satisfactory. The theory underlying the method of determining the significance of the variations in the value of P is somewhat involved when considered in such a form as to cover practically all types of problems. I have already started the preparation of a series of memoranda covering those points in detail. Should it be found desirable, however, to make use of this form of chart in any of the studies now being conducted within the Inspection Department, it will be possible to indicate the method to be followed in the particular examples.
W. A. Shewhart.
Encl: Form of Report.
Note the passage I’ve highlighted about Shewhart’s concern over explaining how he determines the “significance of the variations in the value of P”, with P in this instance meaning proportion or count of total units that are defective. Shewhart’s genius here was realizing that this data likely followed a binomial distribution (ie. good/bad, yes/no) and he could leverage this to calculate estimates of the first three-sigma control limits in history for separating special cause signals from noisy, routine variation in a data set.
And so the venerable p-Chart, first Attribute Chart among its kind was born, soon to be followed by the np-Chart, c-Chart, and u-Chart, but that is a story for another day.
Want to know more? I highly recommend picking up a copy of Dr. Donald Wheeler’s book, Twenty Things You Need to Know, for a mildly-technical dive into the history of the p-Chart and how it differs from the XmR or Process Behaviour Chart we use today.
Related Posts & Further Reading
Control Charts (Nov. 6/21)
The Shewhart Cycle (Nov. 12/21)
Wheeler, Dr. Donald. Twenty Things You Need to Know. (Chapter 17)
Shewhart, W.A. Statistical Method from the Viewpoint of Quality Control
This short book of around 150 pages details all of Shewhart’s thinking on variation and quality, based on a series of four lectures Dr. Deming invited him to deliver in 1938 to the Graduate School of the Department of Agriculture in Washington. It’s a chewy read, but worth it for the Foreword Deming wrote to the 1986 reprint, alone. You’ll learn LOTS.


Ultra cool stuff, thanks